Line of Balance Chart
Line of Balance Method Explained
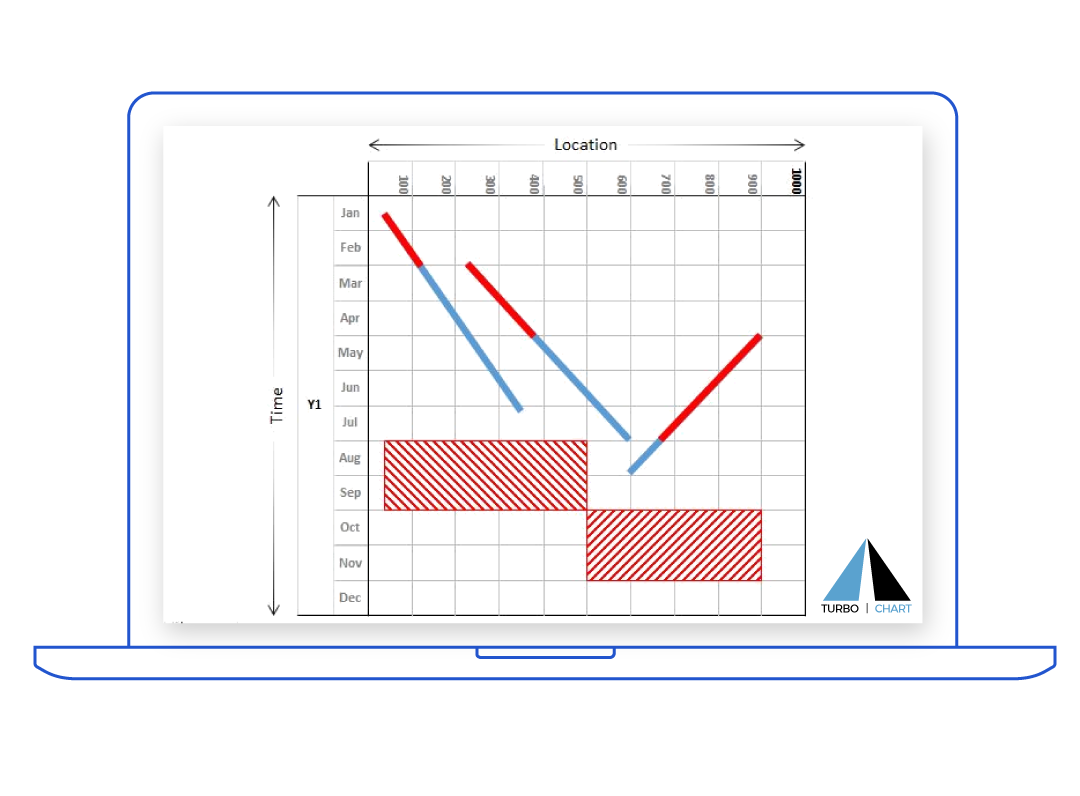
For construction projects, Line of Balance Charts and line of balance software are predominantly used in the commercial building and high-rise construction industries to plan, control and report construction schedules by representing the progress of construction trades across multiple physical areas of construction, such as buildings, floors, rooms or areas. Line of Balance charts uses dual axes. The horizontal axis usually represent time, and the vertical axis is used to represent the physical work areas that the tasks progress through. It should be noted that the vertical location axis is also sequential, meaning that all tasks progress through the work locations in the same order.
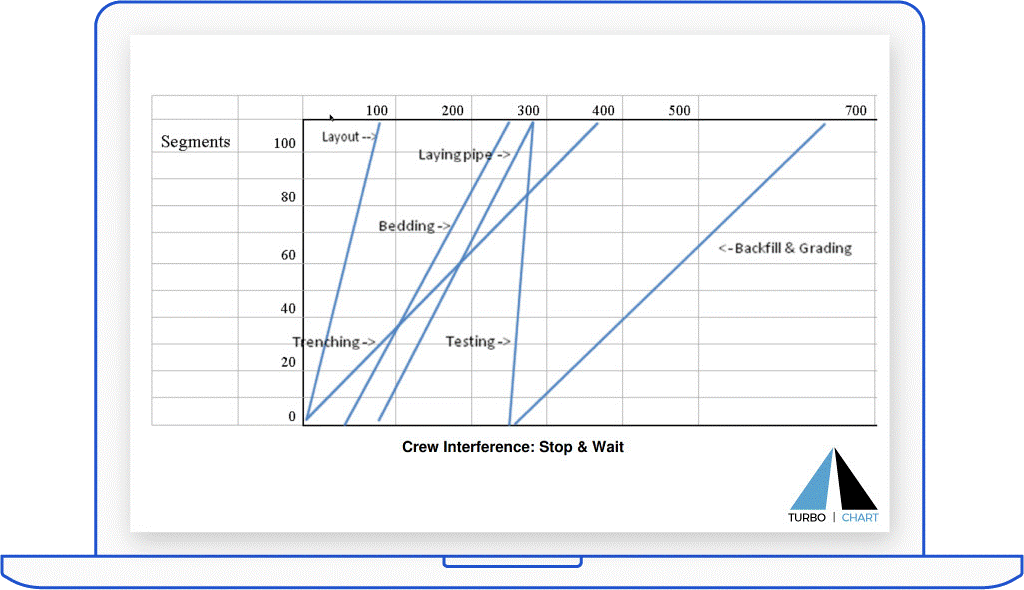
Each line on a line of balance chart represents the total duration that any task will take to complete the work, and the angle of the line of the chart indicates a rate of progress.
A steep line indicates a faster rate of progress, while a shallow line indicates a slower rate of progress.
The space that exists between the differing lines represents the buffer between tasks.
Line of Balance charts is also useful to indicate where scheduling issues may occur, where lines intersect or are too close to one another.
The introduction of set buffers to “balance” lines may be a planning outcome of using lines of balance.

How to Create a Line of Balance Chart
There are three options for creating Line of Balance Charts

Manually drawing charts using a graphical tool

Using software that can convert scheduling data contained in another system into the Line of Balance Chart

Software that allows planning and scheduling in a line of balance format
Turbo-chart falls within the second category – by connecting to scheduling data contained in popular project scheduling tools like Primavera P6, MS Project, Asta Powerproject and allowing the Generation of time location charts that use continuous location axes. By introducing location values as discrete blocks, the scheduling data can be easily converted to a line of balance diagram. Turbo-Chart instantly updates the line of balance diagram as the schedule is updated in the linear scheduling tool.

Drawing a Line of Balance Chart
Whichever of the methods described above are selected to draw line of balance charts, the principles of planning and scheduling remain true. To optimise the sequencing, resourcing and work methods to provide the desired outcomes in the shortest project time. An example provided by Mosiac Projects on their page illustrates the benefits of drawing Line of balance, where a project duration of approximately 700 days is reduced down to almost 450 days by considering options presented by using line of balance charts.
TURBO CHART CAN BE USED TO APPLY LOCATION-BASED SCHEDULING TECHNIQUES
The advantage of Line of Balance methods compared to traditional CPM techniques is the greatly reduced number of tasks and relationships between tasks required by using Line of Balance methods. Combined with the visual benefits of presenting entire project schedules on a single chart, the benefits of Line of Balance diagrams are worth consideration on all projects where the method may be suitable.
Further explanations of the line of balance method are listed here
-
Mosiac Projects White Paper: Line of Balance:; https://www.mosaicprojects.com.au/WhitePapers/WP1021_LOB.pdf
-
Wikipedia: Linear Scheduling Methods: https://en.wikipedia.org/wiki/Linear_scheduling_method
